 |
Tutorial 04 |
Algebra |
|
Solving basic algebraic equations with Excel |
|
 |
back to actions |
on to symbols |
 |
Excel is very useful when solving algebraic equations. The program, however, will not actually perform any algebraic operations; you must supply the proper formula.
 For instance, we can use Excel to determine the
thickness of one sheet of paper. Say we know that a ream of paper contains
500 sheets
and is 4.895 cm thick.
The thickness of a single sheet can be determined by dividing the total
thickness by the total number of sheets in the ream. Let's utilize the
spread sheet
program by first recording our known values, i.e., the total number
of sheets and the total thickness. These are entered into columns A and
B, respectively, in the example below. The formula (=B2/A2) can then
be entered
in cell C2. The worksheet example is shown below.
Note that the cell containing the formula is highlighted and the equation is also printed and highlighted.
Worksheets submitted for grading:
When submitting worksheets,
it is important that you
highlight and print your formulas so your instructor can follow your steps
and and
help
you identify
errors. Also
be sure to print the grid lines and the Row and Column headings. For information
about these and other basic actions, see the
previous
tutorial.
Tables and Graphs submitted for grading:
When submitting Tables and graphs
as part of a formal lab report need to conform to the Department of Biology Style Manual and grid lines and formuli would not be included.
 Here is another slightly more complicated
example in which Excel can save you an enormous amount of work. Let's say
that you
need
to determine
the
protein
concentration in each of ten cockroach gut samples. You have a calibration
curve that relates spectrophotometric absorbance at 595 nanometers= to protein
concentration with the linear equation y = m * x + b or in this case; absorbance
= (protein concentration + the y intercept)/ slope. Abs = (m * [Pr]
+ b). Solving for X or protein concentration allows you to use spectrophotometric
readings to determine protein concentration from the formula. [Pr]
= (abs - b)/m. Therefore your worksheet may look like the following:
 We can use the work in the above example to determine the protein
concentration even if we needed to dilute the sample to get an on scale reading
from the
spectrophotometer. If for example we dilute the sample with 4 volumes of
water, the original protein is now in 5 ml of water instead of 1ml (a 1:5 dilution)
and we will have to multiply the protein concentration of the diluted solution
by the dilution factor (5) to determine the original protein concentration.
This is a trivial operation for Excel as shown below. :
To determine the protein concentration for any of your roach gut samples, all you need to do is change the contents of cell A2 and D2 to the absorbance and dilution factor for that sample and the protein concentration is automatically recalculated for you! There is no need to alter or retype any of your formulas!
hese are pretty simple formuli and reentering the numbers
on a calculator might not be as difficult as learning Excel. Here is an
example that might
convince you that it is easier to learn to enter formuli in Excel. The general
quadratic equation is given by  .
Its solution is, of course, the quadratic formula, or

 Say we are given the
quadratic equation,
  ,
and we wish to find both of its solutions. We can use Excel to help us do this
and the screen shot below shows how that is done. (The spaces within the formula
were added to make the formula easier to read, but are not necessary.)
Of course, to solve another quadratic equation, all one needs to do is change the values of the constants a, b and c in cells A1, B1 and C1. There is no need to alter the formula and the new result is given immediately after the new values are entered!
Are you beginning to see how Excel can save you time in preparing lab reports?
 Lets consider one last example with which all are familiar. You should know
that the volume of a sphere is given by the formula
  ,
where r is the sphere's radius and p = 3.14159.
In this example, we are told that the volume of a bacterium is 7200 µm3.
Use Excel to determine the radius of the bacterium. First, remembering your
seventh grade algebra rearrange the equation to
 .
Theis screen shot shows one way to use Excel to solve for the radius:
 In the above example, we used the number 3.14159 to represent
the constant p.
Excel has a built-in constant, PI( ), which returns the value for p when
used in an Excel formula. Therefore, the equation for the radius in the above
example can be rewritten as shown below:
Either method is fine to use. Some prefer to use the numerical value and some prefer to use the built-in constant. The choice is yours but I know that I can't write out p to 15 decimal places and Excel can.
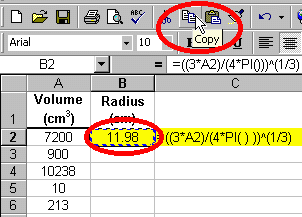
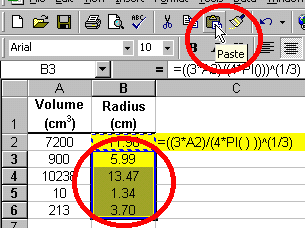
 Finally, let's say, that we know the volumes of four other bacteria and we
would like to determine their radii so we can identify them under the microscope.
You could simply change the value of cell A2 in the above examples and determine
the radius of each sphere one at a time. You could type new formulas for each
sphere. Or you could use the copy and paste functions that you
learned of in the previous tutorial and use the
time you saved for truly significant endeavors like watching reruns of the
Simpsons.

See the complete list of Excel's built-in mathematical
and trigonometric functions and their descriptions.
 |
back to actions |
on to symbols |
 |
Copyright © 2000, St. Mary's College of Maryland. All Rights Reserved.
Please send comments, problems or request for topics to
Walter I. Hatch
wihatch@smcm.edu
August 11, 2005