
Tutorial 01
|
Tutorial 01 |
Terminology |
|
Some Excel terms you need to know |
|
 |
back to the index |
on to arithmetic |
 |
Let us begin our Excel tutorial with a discussion of the terminology that we will use throughout the tutorial. It will be helpful if you have your copy of Excel open while reviewing these pages.
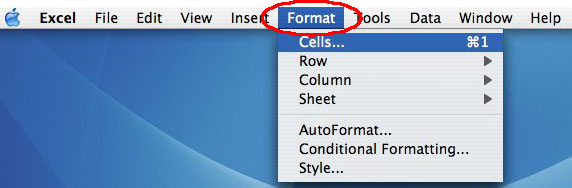
The menu bar contains drop down menus which provide access to virtually all Excel functions.
![]()
When Excel is run on a Mac the menu bar will appear located across the top of the monitor only when Excel is made the active window. PC users will always see the menu bar across the top of the Excel window but it will only be come functional when the Excel window is active.
The menu bar provides access to drop down menus for each heading. The illustration below demonstrates the drop down menu displayed by clicking the Format heading.
Toolbars are collections of icons that will perform common actions with a single click thus making it unnecessary to navigate layers of drop down menus. The standard tool bar shown below will indicate a new file, open existing files, save the current file etc.
![]()
Tool bars are accessed from the View drop down menu. I recommend that you display the Formula Bar along with the Standard and Formatting tool bar by checking them on the drop down menus as illustrated below. Displaying the Drawing will give you access to the add Text box button needed for placing legends on graphs.

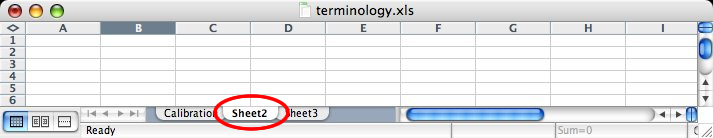
A worksheet is one page of the Excel spread sheet document referred to as a workbook. The tabs at the bottom of the spread sheet tell you on which worksheet you are working. The image below shows that sheet #2 is active. When using Excel in conjunction with your labs, you will most likely use one worksheet per laboratory but there are many times when several sets of data are used in a single report and several worksheets with properly la bled tabs will prove most useful. You can see that sheet 1 has be relabeled Calibration in this example.
 A cell
is one block within the worksheet. It is in the cell that you will type formulas,
insert data and display information like column or row headings. You can change
the color, size and border of each cell along with the color size and font of
the data it contains.
A cell
is one block within the worksheet. It is in the cell that you will type formulas,
insert data and display information like column or row headings. You can change
the color, size and border of each cell along with the color size and font of
the data it contains.
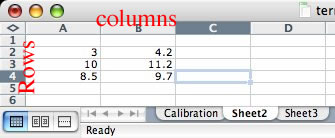 Each cell is identified by its unique column and row heading. Excel refers to
columns with letters (A through IV, for a total of 256 columns) and refers
to rows with numbers (1 through 65536). These letters and numbers are
called row and column headings and are shown in gray in the image to the left.
Each cell can be referenced by entering the column letter followed by
the row number of the desired cell. For example, the encircled cell in the above
image is known as cell A2, because the cell lies at the intersection of column
A and row 2.
Each cell is identified by its unique column and row heading. Excel refers to
columns with letters (A through IV, for a total of 256 columns) and refers
to rows with numbers (1 through 65536). These letters and numbers are
called row and column headings and are shown in gray in the image to the left.
Each cell can be referenced by entering the column letter followed by
the row number of the desired cell. For example, the encircled cell in the above
image is known as cell A2, because the cell lies at the intersection of column
A and row 2.
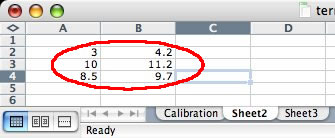 You
can refer to a single cell or to a range of cells, enter the reference
for the cell in the upper-left corner of the range, a colon (:), and then the
reference to the cell in the lower-right corner of the range. The image at the
right shows three numbers in column A and three in column B. The reference to
these cells is thus defined as (A2:B4).
You
can refer to a single cell or to a range of cells, enter the reference
for the cell in the upper-left corner of the range, a colon (:), and then the
reference to the cell in the lower-right corner of the range. The image at the
right shows three numbers in column A and three in column B. The reference to
these cells is thus defined as (A2:B4).
A formula is an equation that performs operations
on worksheet data. Formulas can perform mathematical operations (such as addition
or multiplication), statistical functions (like average or standard deviation),
logical operations (true or false) or they can compare worksheet values. Formulas
can refer to constants, or other cells on the same or different worksheets .
While using Excel in conjunction with the Biology labs, you will create your
own formulas as well as use predefined formulas that are built-in to the Excel
program.
![]()
Each formula can be entered and edited on the formula bar, located near the top of the spread sheet. As an example, the equation in the formula bar shown above multiplies the value in cell B4 by 25 and then divides the result by the sum of the value in cell D5.
You can also use constants in your formulas. These constants can be numbers
(2, 365 or 6.022 x 10 to the 23 ), predefined constants (PI( ) or EXP(1)), or
references to a constant, like a calibration factor, defined within the worksheet.
Microsoft Excel also contains many predefined, or built-in, formulas, which are known as functions. Functions can be used to perform simple or complex calculations. In Biology labs the most frequently used functions are the math (used for more complex math like summing a column or finding square roots) and statistical function (used for a variety of statistical functions from averages to analysis of variance).
|
back to the index |
 |
on to arithmetic to |
|
Copyright © 2000, St. Mary's College of Maryland. All Rights Reserved.
Please send comments, problems or request for topics to
Walter I. Hatch
wihatch@smcm.edu
August 11, 2005