 |
Tutorial 01 |
Ribon terminology |
|
Some Excel terms you need to know |
|
 |
back to the termonology |
on to arithmetic |
 |
The addition of the ribbon is the single largest change from Office 08. It is nothing more than a collection of 7 different toolbars each designed to augment one type of task like reviewing and annotating workbooks, manipulating data, working with formulas, adding graphic elements (not graphs but artsy stuff), working with charts (graphs), working with tables, and in the home ribbon a general set of tools used for basic formatting.
This puts every function in one place and if you don't mind memorizing 400 icons, it simplifies working with spreadsheets. Fortunately you don't need all 400 functions at this point in your academic carrier and this tutorial should help isolate the ribbon functions most important to biology labs.
The ribbon below demonstrates the tabs used to access specific tool sets.

This is the "working ribbon" and most users park here unless something else is needed. We will explore the important tools made available under each of the green tabs shown here. As you can see the icons are divided into font, alignment, numbers, format, cells and themes sections. The format, cells and themes section contains nothing that is compliant with the style manual.

Play with it if you like, but, the layout ribbon is used for high level formatting of printed spreadsheets As you are not ordinarily required to submit or present formatted spread sheets, it contains little of use to Biology students.

The tables ribbon can also be ignored. It is used to define and create tables as defined by Microsoft. While it could be programmed to produce tables that comply with the Biology style manual, The effort and steep learning curve argue against it. You can produce style manual compliant tables by hand both quickly and easily, provided that you have read the style manual.

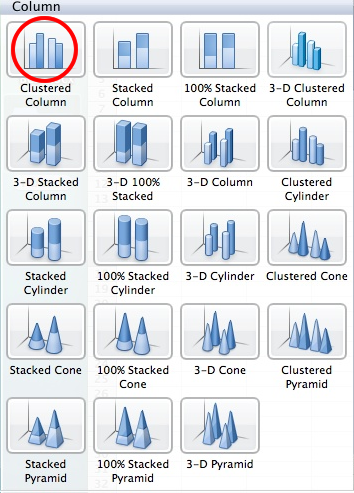
The charts ribbon will, however, require your attention as it contains the tools for producing graphs for your lab repot figures. You do need to understand the terms used on the ribbon to use it effectively. The ribbon shown here has the column graph icon selected. Everyone but Microsoft refers to this as a bar graph. Clicking this will open the selection of graphs indicated below. This graph type is used when your data is nominal rather than numeric ie the X axis represents names (Boston, New York, Washington) or (Mon, Tu, Wed, Tr, Fri). Unless you can justify it, Only the clustered column graph indicated should be selected.


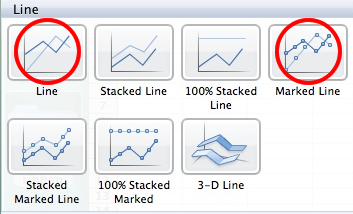
The line graph is also used for nominal data usually days, months or years. It is basically a column graph that is formatted out as a line rather than with bars. Caution: Accidentally selecting this graph type for numeric data will result in serious confusion as you try to interpret or label the graph. For example, a line graph will place 1 and 10 exactly the same distance apart as 10 and 100. This graph is rarely used in biology labs and when it is only the line and marked line are appropriate


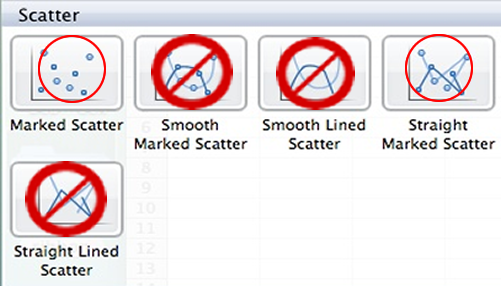
The scatter plot is used for plotting numeric data on both X and Y axis and are meant to illustrate functional (hopefully mathematical) relationship. For instants the weight of a plant as a function of its height. This is and important graph type in the sciences and you will use it often. Caution: It is easy to accidentally select line graph when you mean scatter plot; be care full. Only some scatter plots meet the requirements of the style manual. Pay attention; smoothed curves are never used with out mathematical justification for the shape of the curve.


You may need to insert complex formulas (usually statically) in to a cell and the Formula builder button here can make that easier. It will drop down a categorized list of all of the formulae that Excel knows about. You double click on what you want and a dialog box opens to guide you through entering your data. Not sure what formula to use; try the reference button and read about what the formula are for. Unless you keep your standard toolbar open, you will need to know about this ribbon in order to do statistical analysis

There is little on the data ribbon that you will need for preparing lab reports or analyzing your data, these are primarily business tools. You may find, however, that you could benefit from rearranging your data and the sort tool will permit this. Again unless you keep your standard toolbar open, you will need to know about this ribbon in order to sort data

This ribbon contains tools for annotating a spread sheet. I might use it to add comments to a workbook that you submit. There is one tool you might find useful ant that is the spell check.

No need to worry about this unless you are attempting to use Excel to present cardiograms and that would be a lot of extra work.

 |
back to the terminology |
on to arithmetic to |
 |
Copyright © 2000, St. Mary's College of Maryland. All Rights Reserved.
Please send comments, problems or request for topics to
Walter I. Hatch
wihatch@smcm.edu
January 12, 2012