 Laboratory
3Laboratory
3
Laboratory
3Laboratory
3Metabolic rate can be measured most directly as the rate of heat energy released from an animal's body, a procedure called calorimetry. Measuring heat released from an animal's body with any degree of precision requires very special and expensive instruments, so physiologists routinely measure a process that is correlated directly with heat production: rate of oxygen consumption. This indirect calorimeter has its basis in the knowledge that animals typically release energy for metabolism by aerobic respiration during oxidative phosphorylation.
It is obvious that a larger animal should have a higher rate of energy metabolism, all other conditions being equal, because there is more living substance in it to respire. Physiologists originally hypothesized that one of two logical relationships should govern rate of metabolism: If body mass, the amount of respiring tissue, alone governed metabolic rate, then metabolic rate should be described by the equation MR = aM, where MR = metabolic rate, M is body mass, and a is a proportionality constant characteristic of the group of animals being compared and the units of measurement employed. On the other hand, if metabolic rate were governed by the amount of surface area through which heat energy can escape from the animal's body, the equation should have the form MR = aMb, where b has a value of 0.67 This appears to be related to SA/V relationships, as body size increases, mass increases as the cube (^3) of the dimensions, whereas surface area increases only as the square (^2) of the dimensions, all else being equal.
To their surprise, comparative physiologists discovered that although MR does increase in proportion to the body mass, the exponent b has a value between 1.0 and 0.667, closer to 0.75 in a wide range of animal (and even plant) types. Physiologists do not yet have an complete explanation for this peculiar relationship. One recent proposal by West et al. (1997) is that it is the geometry of branching systems such as the blood vessels in a vertebrate, or tracheal vessels in an insect, that limits the rate at which essential materials can be transported to the cells, and that this geometry of branching down to a set minimum vessel diameter--the diameter of a blood capillary or air capillary--scales to the 0.75 power of body dimensions. This scaling function governing the geometry of branching of the vessels then limits the metabolic rate that can be sustained in the whole body. (The larger the organisms, the more branching nodes there must be, because the initial vessels are correspondingly large.) Thus, surface area to volume ratios are again implicated in this relationship
In this laboratory we will measure metabolic rates, as rates of oxygen consumption, in insects (order Orthoptera) of widely differing body size, to see how their metabolic rates vary with size, and to derive a value for b in the formula above. In doing so you will learn the operation of a modern respirometer, the Micro-Oxymax. The Micro-Oxymax is an indirect calorimeter consisting of a closed system of known volume and pressure containing the organisms and sensors that monitors changes in the concentrations of oxygen and carbon dioxide in the air breathed by each animal over a known time interval. The oxygen detector consists of a fuel cell battery that consumes oxygen to produce an electrical current in direct proportion to the concentration of oxygen in the air. In this instrument, all calculations are done automatically during the experiment, and oxygen consumption values are provided as microlitres of oxygen/minute (mL/min). At the end of the experiment, you can use the data collected and stored on disk to perform the calculations needed to find the value of the exponent b in the equation above.
 We
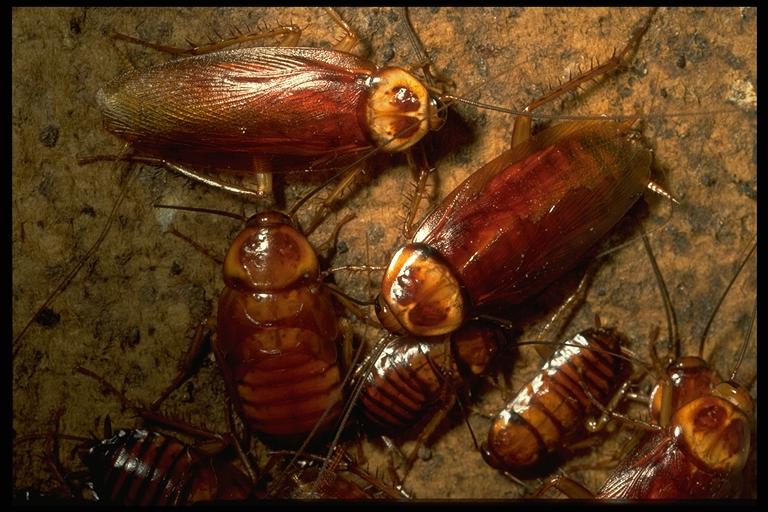
will be using the American Cockroach (periplaneta americanus) as our experimental organism. These creatures are
indigenous to the American tropics where they can be found in moist shady areas outdoors, in yards, hollow trees, wood piles, and mulch. They are active and fast. Males
can be distinguished from females by the presence of longer wings, extending past the end of the abdomen. At the base of the wings are pheromone producing glands Male roaches produce seducin in these glands; females produce erectin. You can likely figure out how they are involved in mating. . A few days after mating
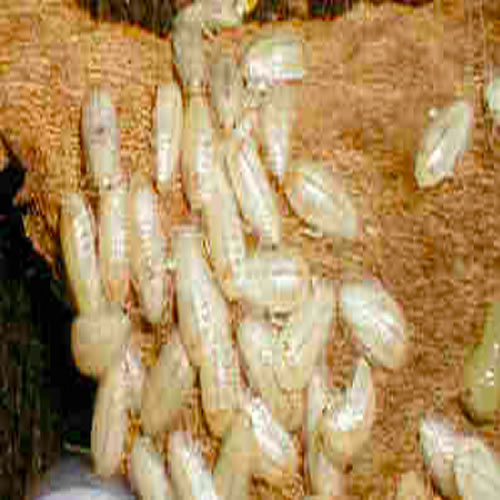
the female can be seen with an ootheca (egg case) protruding almost all
the way out of her body, The ootheca will be retracted and held to term,
with the female giving birth to about 12 to 36 young nymphs. The young
molt through several instars. These instars will provide you with
several discreet size classes as with all arthropods growth occurs only
at the molt.
We
will be using the American Cockroach (periplaneta americanus) as our experimental organism. These creatures are
indigenous to the American tropics where they can be found in moist shady areas outdoors, in yards, hollow trees, wood piles, and mulch. They are active and fast. Males
can be distinguished from females by the presence of longer wings, extending past the end of the abdomen. At the base of the wings are pheromone producing glands Male roaches produce seducin in these glands; females produce erectin. You can likely figure out how they are involved in mating. . A few days after mating
the female can be seen with an ootheca (egg case) protruding almost all
the way out of her body, The ootheca will be retracted and held to term,
with the female giving birth to about 12 to 36 young nymphs. The young
molt through several instars. These instars will provide you with
several discreet size classes as with all arthropods growth occurs only
at the molt.
In order to compare metabolic rates for different animals under similar conditions, we must standardize the conditions of measurement as much as possible so that all animals are as close as possible to comparable physiological conditions. Therefore, the animals should all be at rest, neither moving about exploring their surroundings, nor grooming themselves. They should also be post-absorptive, that is, not digesting, absorbing, and assimilating foods, but existing on their stored fat reserves. They should all be at the same environmental and body temperature. Thus, all animals should be as near as possible to the lowest rate of metabolism consistent with minimal maintenance needs at the same specified temperature. This measurement, the Standard Metabolic Rate (SMR) must be calculated by extrapolating to zero from several active metabolic rates. This is beyond the scope of this lab so we will calculate average and resting metabolic rates. Even this is difficult as it is very hard to make an animal rest so as to measure its RMR. One generally has to wait for it to go to sleep, or otherwise come to rest, then collect metabolic measurements while it is quiescent. Therefore, we will start the experiment during the laboratory period, and allow the Micro-Oxymax to collect measurements for at least 24 hours. Measurements during this extended run should level out at a minimal rate at some time for each animal, provided it enters a resting state. These values will be considered to represent RMR for that animal. These data will be posted the next day and you can then put into a spreadsheet for analysis. You can also use paper, pencil, and calculator if you wish but this will, of course, cast some doubt on either your sanity or your tendencies toward masochistic machinations.
 Carefully
select roaches of the same size for each of your size classes.
You should avoid using very large old roaches as senescence affects
metabolic rate. You might even want to avoid adults altogether, as sexual
maturity certainly affects metabolic rate. You also need to avoid freshly
molted animals as they will be under considerable metabolic stress.
These nymphs can be identified by their color.
Carefully
select roaches of the same size for each of your size classes.
You should avoid using very large old roaches as senescence affects
metabolic rate. You might even want to avoid adults altogether, as sexual
maturity certainly affects metabolic rate. You also need to avoid freshly
molted animals as they will be under considerable metabolic stress.
These nymphs can be identified by their color. 1. Calculating SMR for each subject: The raw values for oxygen consumption are in ml/min. These are shown as negative values because oxygen was being consumed by the animal, so amounts were going down in the sample chamber air by the amounts indicated. You may disregard the minus signs in subsequent calculations, provided all values in your data set have the same negative sign.
2. For each experimental chamber, find a series of at least five samples in which the mean oxygen consumption rates and the standard deviation are lowest. This can be done by visually inspecting the data or you might try a more sophisticated moving boxcar average (3 to 5 samples). This mean will be our best estimate of SMR for that organism or group.
3. Plotting SMR versus Body Mass. In plotting data relating SMR to body mass, physiologists usually plot the logarithm (base 10) of the SMR on the ordinate against the logarithm of the body mass on the abscissa. The equation for the relations ship is thereby transformed from
MR = aMb to log MR = log a + b (logM)
With this transformation, the curve for the equation becomes a straight line, in which the slope of the line is specified as the value of b in the familiar y = mx+b equation for a straight line. Remember to correct the values for both MR and mass when you have more than one roach in a jar. You want the metabolic rate and mass for the average individual roach.
4. Calculating Mass-specific Metabolic Rates. -- To get another comparison of smaller versus larger animals, divide the mean rate ( mL min-1) of each animal by its initial body mass in mg (mL min-1mg-1), and then multiply by 60 min hr-1 to get all rates in units of mL O2mg-1hr-1. Again you want the mass-specific metabolic rate for the average individual roach to use in your graphs. Your measurements in these units now have the same numerical value as mL O2 g-1 hr-1, and Liters O2kg-1hr-1. You can therefore easily compare our measurements with those for various animals discussed in your textbook and other references.
If the data warrants it, a report would be a good idea. This laboratory exercise does not, however, require a formal lab report. If you do not submit a formal report you should submit a series of graphs demonstrating the relationship between body mass and metabolic rate and paragraph discussing the significance of this relationship. .
Speakman, JR, 2005, Body size, energy metabolism and lifespan
van Bergen, Y and K Phillips, 2005, Size matters
West, GB and JH Brown, 2004, Life's Universal scaling laws
White, CW, and RS. Seymour , 2005, Allometric scaling of mammalian metabolism,
Walter I. Hatch
wihatch@smcm.edu
September 16, 2012