Mapping Properties
[Domain & Range] [Mappings & Functions] [1-1 & Horizontal Line Test] [Onto & Horizontal Lines] [Bijection]
History of Descartes
The mathematician, René Descartes (1596 - 1650), "saw that a point in a plane could be completely determined if its distances, say x and y, from two fixed lines drawn at right angles in the plane were given, with the convention familiar to us as to the interpretation of positive and negative values; and that though an equation f(x,y) = 0 was indeterminate and could be satisfied by an infinite number of values of x and y, yet these values of x and y determined the co-ordinates of a number of points which form a curve, of which the equation f(x,y) = 0 expresses some geometrical property, that is, a property true of the curve at every point on it. Descartes asserted that a point in space could be similarly determined by three co-ordinates, but he confined his attention to plane curves"(Ball).
From this, we now know that the coordinate plane exists because of the work done by Descartes. He helped create the system we have today. Before his theory on analytic geometry, we had no graphical way of representing a mapping.
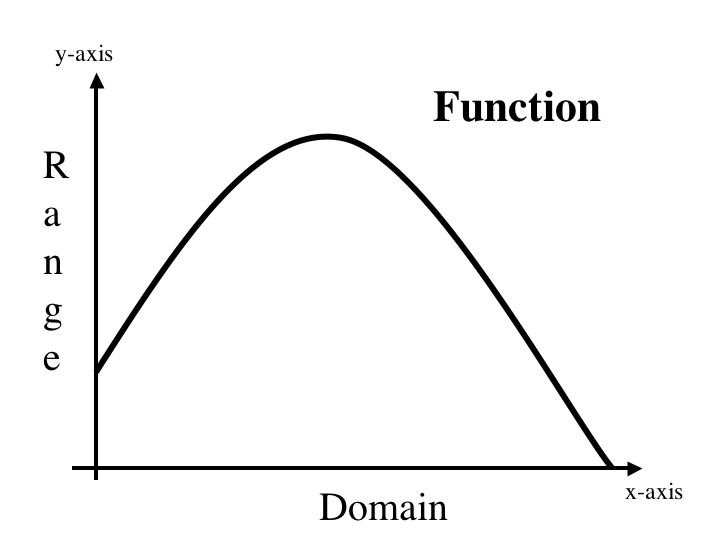
When graphing on a coordinate plane, the domain is represented by the set of values on the x-axis, while the range is the set of values on the y-axis. The domain is a set of numbers that we can input into the function and the range is the set of all possible values that we can get out of the function. Each number in the domain will map to a unique number in the range. Given an x in the domain, it will map to exactly one y in the range. In a coordinate plane we represent each mapping as (x,y). The graph we create in the coordinate plane demonstrates the relationship between the domain and range.

According to the definition of a mapping, every element in one set maps to a unique element in another set. Each value of the independent variable in the domain has exactly one value of the dependent variable in the range. Let's look at the vertical line test. A graph is said to be a function if it passes the vertical line test. If G fails the vertical line test, like below, it means that there exists a value on the x-axis that maps to two different values on the y-axis.
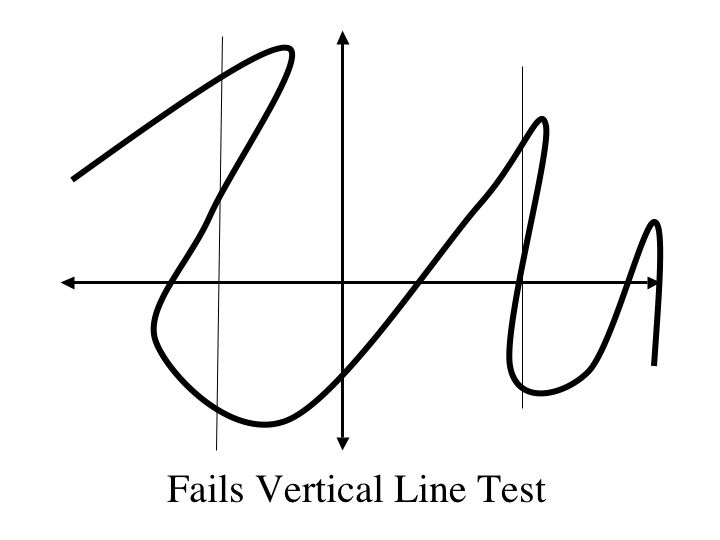
This would also mean that this graph would not be a mapping because one element in the set, we call the domain, maps to two elements in another set, we call the range.

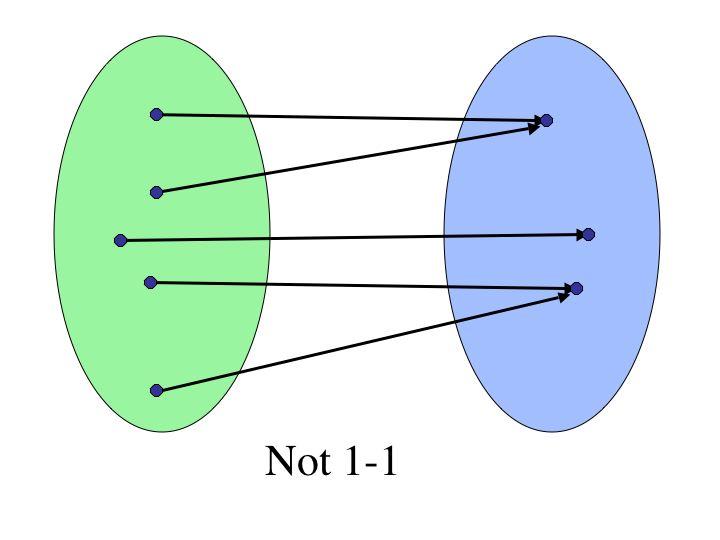
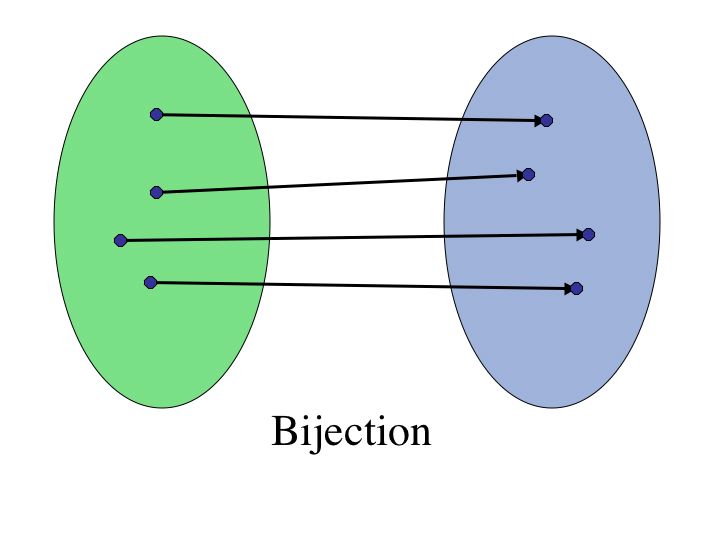
Whether we graph the functions and use the vertical line test, or draw ovals containing each set and then map each element in one set to the other, we have still created a way to show whether or not we have a function or a mapping.
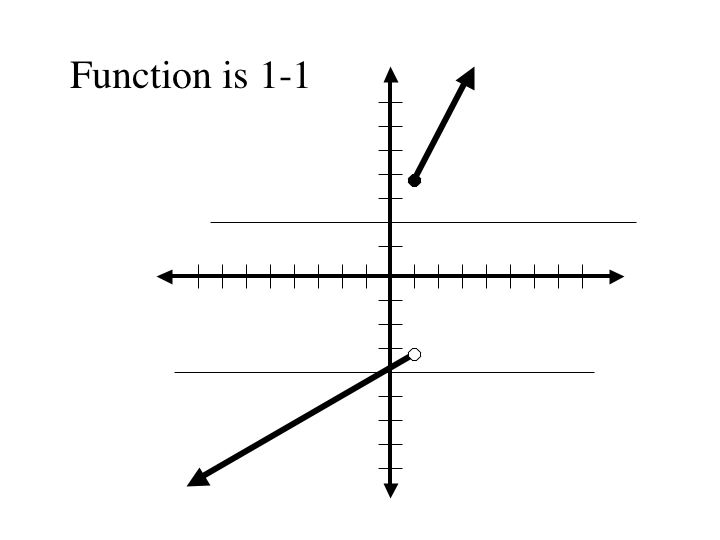
The Horizontal line test on a function tells us if the function is 1-1. If we are creating a mapping with ovals, and more than one line connects to one element in the right oval, then the mapping is not one-to-one because given two elements in one set, they will map to two different elements in a set. If they map to the same element, then the two original elements must be the same.
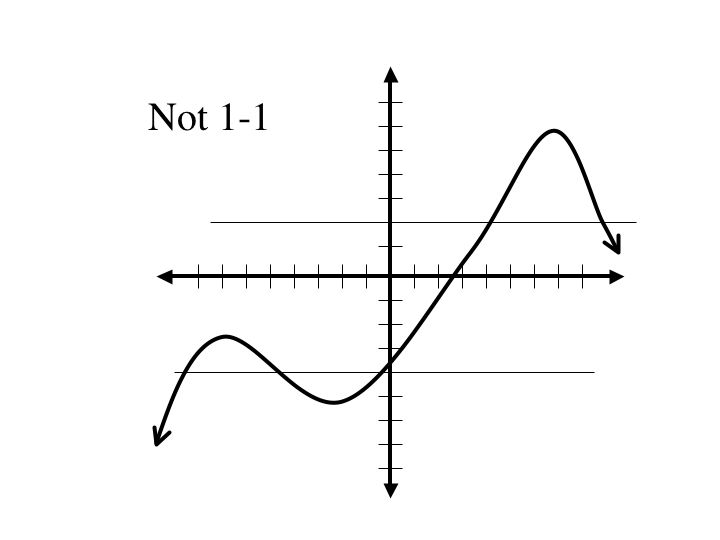

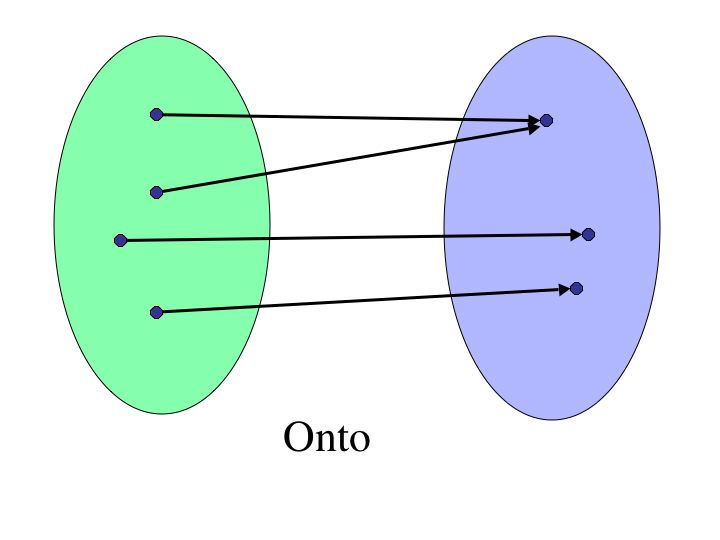
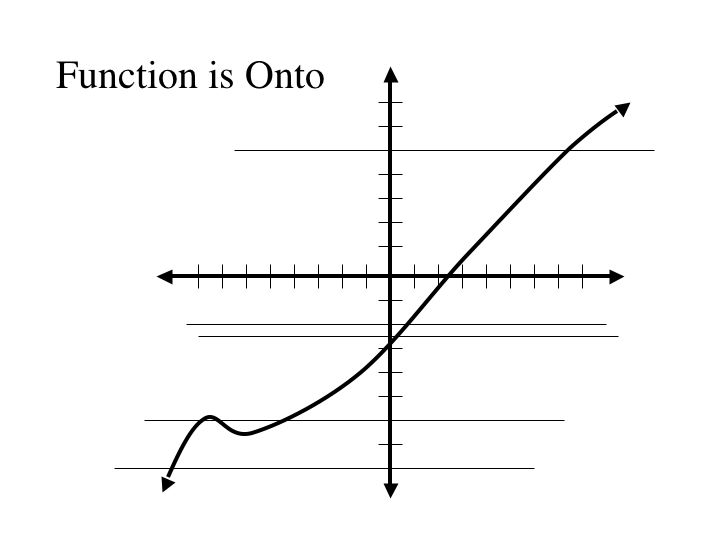
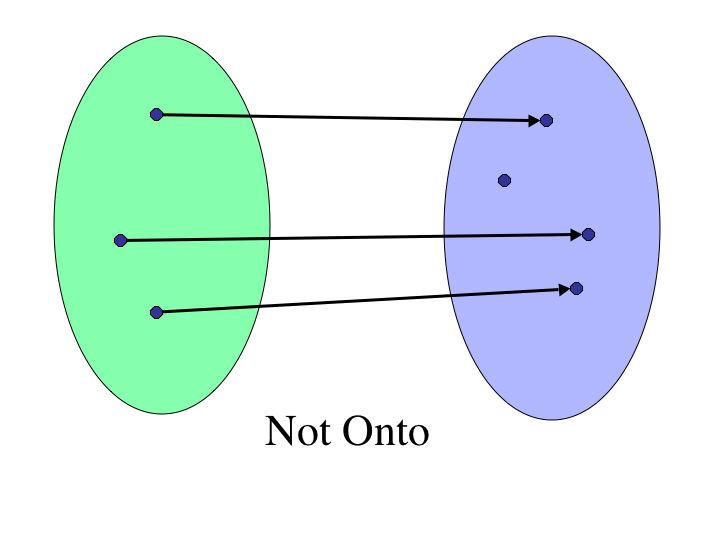
Drawing a horizontal line also allows us to test whether a function is onto. Given a function, if we can draw a horizontal line through every point in the real numbers, hitting at least one point on the graph of the function, then the function is onto.
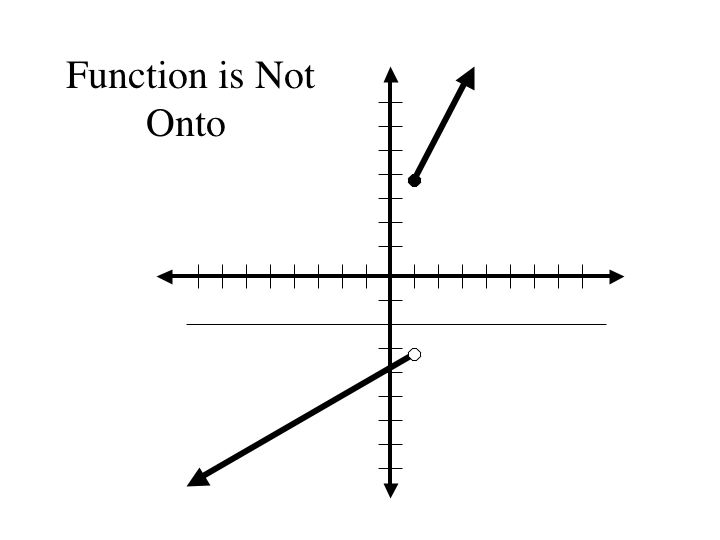
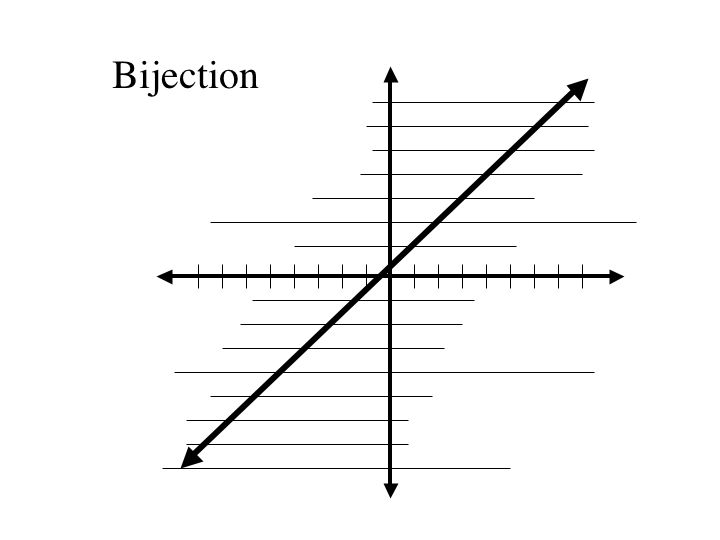
Let's look once again at horizontal lines. If we can draw a horizontal line through every value in the range, hitting exactly one point on the on the graph, then function forms a bijection.
© 2004
Rebecca Talbot |
Site Managed by |
All Rights Reserved |